|
 |
 |
Our environmental load in 2022 through business activities is as follows. |
|
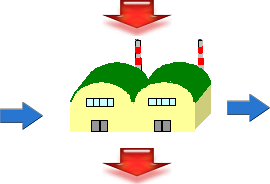
Schematic environmental load in manufacturing activities |
|
|
INPUT
| Energy |
Compared to last year |
Water |
Compared to last year |
| Purchased electric power |
26,969 Mwh |
97.3% |
Clean Water |
3,681m3 |
94.8% |
| City Gas |
10,073thousandsm3 |
85.8% |
Industrial water |
21,525m3 |
104.6% |
| Heavy Oil |
1,636 KL |
- |
Well water |
39,896m3 |
100.9% |
|
|
 |
|
|
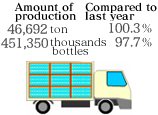
OUTPUT
|
Compared to last year |
|
Compared to last year |
| Waste |
305ton |
89.6% |
Discharged water |
| Industrial waste |
153ton |
107.7% |
Discharge of drainage |
45,878ton |
98.8% |
| Industrial waste subject to special control |
8ton |
150.0% |
|
| General waste |
25ton |
96.2% |
Amount of emission of Green house gas in terms of CO2 |
|
|
| Amount of recycled resources |
119ton |
71.3% |
39,075ton |
95.4% |
| |